How to backtest ICT and SMC setups without fooling yourself
ICT and Smart Money Concepts (SMC) are hugely popular with Nigerian traders, and they are also very easy to fool yourself with. On a finished chart every order block looks perfect. The only honest test is to hide the future and trade the setup as it forms.
Why ICT and SMC are hard to backtest
- Hindsight. Once you can see where price went, you pick the order block that held and ignore the three that failed.
- Loose definitions. “Displacement” or a “valid” fair value gap means different things on different days unless you write it down.
- Several timeframes. The bias comes from the 1-hour or 4-hour chart, the entry from the 5-minute or 1-minute chart, and you need both moving together.
Step 1: Write the setup as rules
Here is an example of a simple model written so it can be tested. It is an example to test, not a recommendation:
- Bias: on the 1-hour chart, the last swing high or low that was broken by a candle close sets the direction.
- Time: only trade inside the London or New York kill zone (see ICT kill zones in Nigerian time).
- Liquidity: price must first take out the Asian session high (for sells) or low (for buys).
- Entry: after the sweep, a 5-minute candle closes back inside the range and leaves a fair value gap; enter at the gap.
- Stop: beyond the sweep high or low. Target: 2R, or the opposite side of the Asian range.
- Skip: days with high-impact news inside the kill zone.
Every rule should be answerable with yes or no by someone else looking at the same chart.
Step 2: Set up the charts
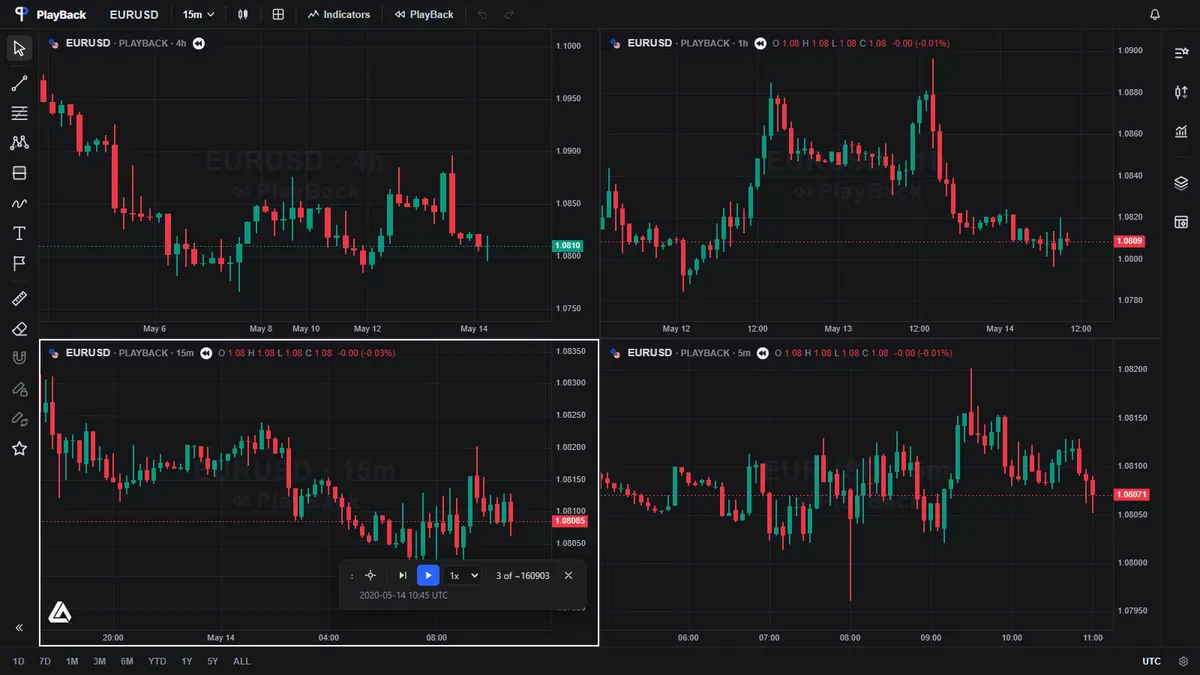
PlayBack Forex opens with four charts side by side (for example 1h, 15m, 5m and 1m) that all move together during PlayBack, so the higher-timeframe bias and the entry chart stay in step. Pro also lets you add your own custom timeframes such as 2m, 3m or 45m if your model uses them. Mark your ranges and gaps with the drawing tools as you go.
Step 3: Hide the future and trade it
Pick a day you haven’t studied, press PlayBack and click a candle just before the Asian session ends. Step forward candle by candle through the kill zone. When every rule is met, place the trade with its stop and target from the order ticket. If a rule isn’t met, don’t trade, even if it “looks good”.
Honest limits: PlayBack Forex uses 1-minute candles, not tick data, so fills inside a single 1-minute candle are approximate. That is fine for kill-zone and FVG entries on 1-minute charts and above, but don’t judge a model that depends on a few seconds of price action.
Step 4: Collect enough trades
ICT models often trade once a day or less, so aim for at least 50 trades across 3 to 6 months, including trending and ranging weeks. With PlayBack you can trade one London session after another in an evening instead of waiting a day for each.
Step 5: Judge it by the numbers
When the session ends, the report shows win rate, profit factor, average R and maximum drawdown for every trade you took. Our guide to win rate, profit factor and drawdown explains what good numbers look like. Then change one rule (for example 1.5R instead of 2R) and test a fresh period.
Common ICT backtesting mistakes
- Moving the bias after the trade goes wrong.
- Counting only the setups that “were valid” once you saw the result.
- Testing only on EURUSD in one month and calling it proven.
- Trading outside the kill zone because the chart looked good.
Testing an ICT model for a funded account? Rehearse the daily loss and drawdown rules too, with our guide to practising a prop firm challenge.
Try it on real history
Open PlayBack Forex in your browser, pick a pair and a start candle, and trade the chart as it unfolds. Free to start.